
IELTS Task 1 · Cambridge 9 — Test 4
The graph below gives information from a 2008 report about…
Spend about 20 minutes on this task. Write at least 150 words.
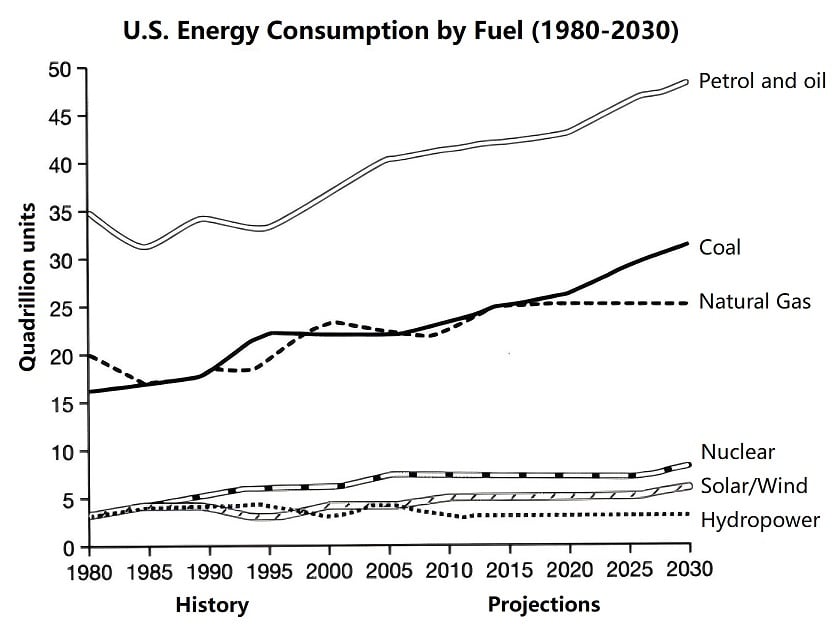
The graph below gives information from a 2008 report about consumption of energy in the USA since 1980 with projections until 2030.
Summarise the information by selecting and reporting the main features, and make comparisons where relevant.
Write at least 150 words.
 Write it in the exam interface
Sample answers
Written by Mockmee candidates in the exam interface and shared unnamed and unedited, with the AI marks they got.
More IELTS Task 1 questions
The graph below shows the annual pay (thousands of US dollars) for doctors and other workers in seven countries in 2004.
The graph below describes the use of fixed telephone lines, mobile phones, and internet between 1994 and 2005 in China.
The two maps below show an island, before and after the construction…
The two maps below show an island, before and after the construction of some tourist facilities. Summarise the information by selecting and reporting the main features, and make comparisons where…
You should spend about 20 minutes on this task.
You should spend about 20 minutes on this task. The graph below gives information on the numbers of participants for different activities at one social centre in Melbourne, Australia for the period…
You should spend about 20 minutes on this task.
You should spend about 20 minutes on this task. The charts below give information about a public library in a town called Little Chalfont. Summarise the information by selecting and reporting the…
You should spend about 20 minutes on this task.
You should spend about 20 minutes on this task. The chart below shows how frequently people in the USA ate in fast food restaurants between 2003 and 2013. Summarise the information by selecting and…
You should spend about 20 minutes on this task.
You should spend about 20 minutes on this task. The maps below show the centre of a small town called Islip as it is now, and plans for its development. Summarise the information by selecting and…
Mockmee is not affiliated with, endorsed by or connected to IELTS, the British Council, IDP or Cambridge.